The Low Maintenance Trading (L.M.T) Concept.
Foreword
It has been a firm belief of mine for many years that with the right trading methodology and a sound risk/money management trading the financial markets become profitable. Profits are achievable with the correct help and guidance. Some may take longer than others to reach financial freedom, nevertheless it is still achievable by anyone who is willing to put in a little hard work. But with so much conflicting, contradictory and just plain bad trading information floating around the internet these days, traders are finding it harder than ever to make a consistent profit in the financial markets. From what I have seen recently many people are on the verge of giving up the dream of trading the markets forever. It’s for this reason I have been motivated to write this special manual. In it reveals years of hard work and discovery. This manual contains more valuable information than 99% of trading courses that are charging hundreds if not thousands of dollars; this information if acted on has the power to change your trading career for the good! You are about to discover and apply what’s called the Low Maintenance Trading (L.M.T) Concept.
So many people fail in this financial trading business, but if you follow the guidance laid down in this manual, while over 95% of traders are losing money you will be quietly pulling money out of the market consistently. You will spend less time each day in front of your charts and have little to no stress. It sounds a little bit prophetic, but that’s what the LMT concept is about. L.M.T once again stands for Low Maintenance Trading. This concept should be behind any most successful and profitable trading method. It is a combination of everything discovered over the years of trading the markets.
Over the following sections of the manual each part of the L.M.T concept is explained in detail. You will then apply it to your trading method and believe you will succeed. I must warn you, this information is not sugar coated, you may discover facts that you will not like. Most people will not agree with what I have to say here, but then again most people are losing money, especially in the forex markets; they need tried and proven guidance!
The LMT Concept - Explained
Time Frames
When most people think of forex trading they imagine intense trading action on small time-frames, in and out in a few minutes and bang you just made $1000! Everything to do with forex is geared towards getting people to day trade. Almost all forex brokers offer ridiculously high leveraged accounts and most adverts will have you believe that day trading is as easy as pie. If you have spent any time at all trading forex you will have already discovered that it’s not as easy as you originally thought. Scalping the 5minute charts becomes extremely stressful when the market is always doing the exact opposite of what you expect. Trading the correct time-frame is paramount to making consistent profits in the forex markets. New traders coming into this business are drawn to the low time-frame charts for the fast action and quick profits. However, there are serious problems associated with trading these low time-frame charts (without considering the higher timeframe waves/trends!) that most people don’t realise or understand. Here are some disadvantages working against you when trying to day trade these small time-frames without considering the higher timeframe waves/trends!
· Random Market Noise- The markets are random but this randomness can be predicted and profited from on a consistent basis. However, the lower in time-frame you go the more random market noise becomes and the harder it is to predict the market direction consistently. This random market noise is often the cause of your stop loss triggering just before the market moves in the direction you intended.
· High Cost- Taking several trades each day for a few pips creates a lot of cost in spread (broker’s commissions!). An average day trader can take around 10 trades in a day. Using the EURUSD as an example which has a low spread of just 2 pips, the day trader has already lost 20 pips just in commissions to the broker. Not only does this affect overall profits but this has a serious effect on the trader’s edge in the markets and chance of finishing the day with any profits at all.
· Screen Time- Most day traders find it difficult to produce consistent profits because of the random market noise, which will often take out their stop loss. Those few that do succeed in day trading wind up becoming a zombie watching a computer screen for up to 12 hours a day. The dream of freedom that trading the markets can provide is far from realised and often day traders end up working more hours than in a regular job.
· High Stress- Trading on small time-frames requires a lot of concentration, constantly watching the markets for up to 12 hours a day is enough to stress out anyone and will eventually affect your health and lifestyle.
When combining all these disadvantages of day trading it is not difficult to see why so many traders fail to become profitable and eventually give up. As I said earlier the higher the time-frame you analyse from and merge with the lower timeframes to trade, the easier it becomes to trade profitably. After years of fighting against this rule I now focus almost exclusively on the Weekly/Daily charts analysis over the weekends, then H4/H1 daily analysis, to m15/m5 entry timing anlysis. I have found this to be extremely profitable and gives me great freedom to spend my time doing the things I enjoy. On a weekly/daily chart each candle represents a day’s/week’s worth of trading respectively. This means, you only have to check your charts once each weekend/day respectively, each evening close you scan through each currency pair for a signal/ setup, which takes less than 15 minutes each day. With over 20 currency pairs available you will generally have plenty of set-ups each week. Let’s look at some of the great advantages that analysing from the weekly/daily charts provide-
· High chance of success- By analysing on a high time-frame like the weekly and daily charts you have cut out almost all the market noise which is responsible for taking out your stop loss prematurely. Your trades now have an extremely high chance of success; you are now working on the time-frame aligned to that of the banks and institutional traders.
· Huge profitable trades- With big time-frames come big wins. The higher timeframe charts provide huge winning trades of hundreds of pips.
· Free time- This is a huge advantage. If you are working a full-time job, then the higher timeframe charts will make it easy for you to trade around your day job until you are comfortable enough to trade full-time.
· Low costs- Taking fewer trades that are aligned with the higher timeframes will drastically reduce the cost in commissions to your broker. This also adds to your edge giving you a higher chance of success.
· Low stress- Watching trades live all day long will create a lot of mental stress. Using the higher timeframes merged with the lower timeframes trading approach will reduce this stress to almost nothing as you would be taking much fewer but profitable trades a day or in a week.
· Huge Trends- It’s well known that the currency markets have huge trends which continue for thousands of pips. The only way to catch a long term trend is by trading in-line with the higher timeframes.
· Plenty Of Trades- Although most people think a weekly and/or daily chart moves slowly, with say 20 pairs to watch you would be surprised how many trading opportunities you will come across. You can easily average 3-4 trades a week, which have a profit potential of hundreds of pips.
· Small Position size- With today’s forex brokers you can trade micro lots which means you don’t have to over leverage your account to trade in-line with the higher timeframe charts.
· Limited risk- As you can clearly see, trading in line with the higher timeframes gives you huge advantages over day trading the smaller time frames alone. I’m sure you have heard that 95% of forex traders lose money consistently. I believe that 90% of forex traders are trying to trade on small time frames only, while only a fraction are smart enough to merge in the longer term time frames to their advantage.
The Power of a Trend
Have you ever heard the expression ‘the trend is your friend’? This is the most common phrase in trading yet I know of few traders who use the power of the prevailing trend to their advantage. Most traders are constantly trying to pick the bottom or the top of a move, which has the unavoidable result of losing money. Most traders do not realize the immense power of trading with the trend. Think of the trend as the current going down a river, if you try to swim against the current you will find yourself battling hard just to stay in one spot let alone move forward. But by turning around and swimming only in the direction of the current you will find yourself being carried along without much work at all. This same thought process applies to trading the markets, battling against the trend will only bring you stress and more than likely lose you money.
If you only take trades with the trend you can only essentially be wrong once when the trend changes direction. If you take trades against the trend you can be wrong an infinite number of times until you find the top or bottom of the move. Sometimes it helps to zoom out and even move to a higher time-frame to get a good visual view of the overall trend in the market. Trading with the trend is an essential ingredient and will make a huge difference to your trading.
Breathing Space
An enormously overlooked area of trading is the stop loss size, for those of you who don’t know, a stop loss is a pending order to close your position at the point you specify to cut losses. Many traders believe that if they use very small stops the risk on a trade is minimized. The truth is they are forcing themselves out of good trades because of market noise, which regularly triggers their stop loss before moving in the anticipated direction. The secret to trading with the trend is to ensure that your stop is far enough away that any market noise will not trigger it and essentially give your position room to breathe and develop with the overall trend. Your trade now has space to breathe and you have essentially given yourself an even higher chance of success. You are now allowing the overall trend to carry your trade into profit.
Protecting Profits
Give two traders the exact same entries and after several trades you will often find that one is profitable while the other has had consistent losses. This is because of how the individual traders manage their trade once the position is open; it’s how you manage your open trades that will ultimately decide if it will be profitable or not. Using the signals generated by our system and methods to help time your entries to trade with the trend means that a high percentage of the time you will end up with profit in the trade at one point or another.
The key to consistent gains is to try to avoid letting a profit turn into a loss, we can do this by moving the stop to break even and creating a risk-free trade. The only downside to managing a trade this way is you will have some trades stopped out at break even. When this happens you just have to smile and remember you have avoided a potential loss. There are always more trades around the corner and the ones which don’t get stopped out at breakeven will often run for hundreds of pips profit.
Obviously, you don’t want to risk 200 pips and move your stop to break even as soon as you have 10 pips profit. Once you have a 30- 40% profit you should defiantly consider moving your stop to break even and create a risk free trade.
Know When Not To Trade
Trading requires a lot of discipline. A trader’s natural urge is to be in the market as much as possible. However, it is important to remember that “no position” is often the most profitable position to be in.
Using this method ensures you stay away when you need to. This ensures your rising equity curve stays smooth and consistent. Keeping out of the market is as important as trading itself. While most traders are asking themselves how much they could win in a trade you should always ask yourself how much you stand to lose in a trade. Although it’s not often, sometimes during the year you may go a week or two without taking any trades. On some occasions the markets are just not giving any good trading opportunities and it’s best to walk away and remember there will always be more trades around the corner.
Example, times where there are relevant News releases, especially the first Friday of each month. Why? This is the day the US “Non-farm Payroll” report gets released, and before its release all the investment banks/traders will be waiting on the sidelines, so you do get sideways or range trends or choppy trends, just like overnight trends. At the release of the report, the market can swing big time in any direction, and you are better of not in it. You can even close all winning trades to lock in profits the Thursday night before. Simply, sort of let the “random noise” take care of itself before you come in!
Firstly, you need to understand a basic concept of price candle.

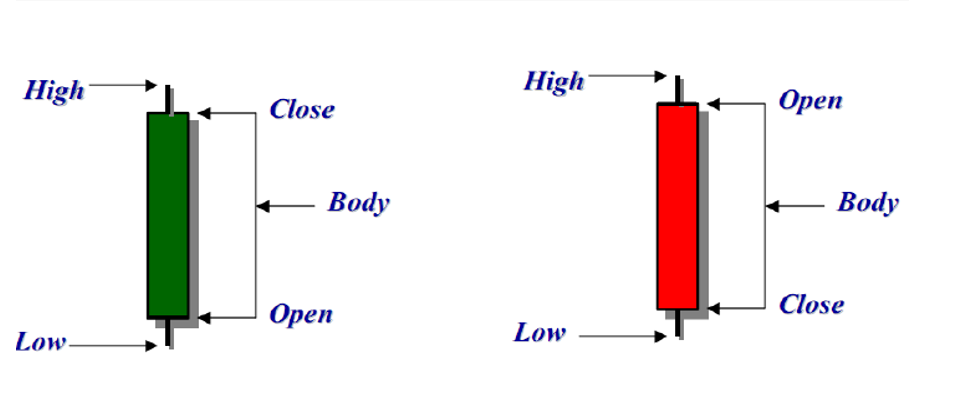
Steven Nison is credited with popularising candlestick charting and has become recognised as the leading expert on their interpretation. Candle chart display the open, high, low, and closing prices in a format similar to a modern day bar chart, but in a manner that extenuates the relationship between the opening and closing prices. Candlestick charts are simply new way of looking at prices, they do not involve any calculations.
Best Times to Trade main Currency Pairs
The following table outlines some Currency pairs to trade at their specified time range. Time is in GMT. Check broker’s market watch and add the offset to the stated times to get the right time on broker’s charts.
| Market | Best Time TO Trade (In GMT) | Pairs |
| Asian | 0:00AM - 5:00AM |
USD/JPY EUR/JPY |
| London / European | 7AM - 11AM |
EUR/GBP EUR/CHF |
| 8AM |
USD/CHF GBP/USD EUR/USD |
|
| New York / London overlap | 11AM - 15:00 |
USD/CHF GBP/USD EUR/USD USD/JPY |
On Fridays if you choose to trade, avoid the following pairs EUR/JPY, CAD/JPY, USD/JPY, SGD/JPY, and the AUD/USD (i.e. all the Yen related pairs). Why? Friday(s) is classed as a highly volatile market day, and secondly the Asian market is closed (it is their weekend!), hence the yen/australasian related pairs are not as active- you get a one sided pair!
Key Advice: Do not trade the first Friday of each month. Why? This is the day the US “Non-farm Payroll” report gets released, and before its release all the investment banks/traders will be waiting on the sidelines so you do get sideways or range trends or choppy trends, just like overnight trends. You could even close all winning trades to lock in profits the Thursday night before.
EUR/USD
The Euro trades 15% of all volume during the Asian session, but it can still have a good move. The Euro trades 39% of all forex volume during the European session.
GBP/USD
The Pound trades only lightly prior to and during the Asian session but can have some good moves. The GBP/USD can be quiet in the middle of the Asian session. In the European session, the pound trades about 23% of all forex trading volume.
USD/JPY
The Yen accounts for approximately 78% of all forex volume during the Asian session. The USD/JPY trading volume drops to about 17% during the European session.
The Asian session opens at 0.00 GMT and closes at 9.00GMT.
The European session is the largest market and opens at 7.00GMT and closes at 17.00 GMT or noon. The US session opens at 13.00 GMT and closes at 22.00GMT. The best trades occur in the first 3 hours.
Often, the best times to trade is at the beginning 3-5 hours of the above mentioned opening times, because the major currency pairs tend to move the most in a particular direction. Especially when there are economic news releases.
The New York and London trading sessions overlap between 11am and 15:00 pm GMT. The volatility is much higher and trading opportunities are much more frequent with bigger moves, especially in these four hours.
The currency pair that moves the most during these hours are the Usd/Chf (#1), then the Gbp/Usd, then the Eur/Usd, then the Usd/Jpy.
If you need help in converting GMT time zone to your time zone, please use this world time zone converter: worldtimezone.com OR Timeanddate.com/worldclock
Recommended foundational studies (a prerequisite to using the HN Market Cycles Signals services):
1. Candle Theory Mastery (Jea FX vids.)
2. Real Supply & Demand Mastery (Jea FX vids. & Pips of Persia)
3. Market Structure Mastery (Jea FX vids. & Pips of Persia)
4. Liquidity Mastery (Liquidity Inducements and Liquidity Sweeps!) (Jea FX vids. & Pips of Persia)
5. Top Down Analysis (Jea FX vids. & Pips of Persia)
6. Institutional Candles (ICs), Insufficiency/Imbalance zones/Fair value Gaps (Jea FX vids. & Pips of Persia)
7. Entry Timing Mastery (Jea FX vids. & Pips of Persia)