Signal Entry Timing Methods
[1] The Demand/Supply zones Entry timing Method
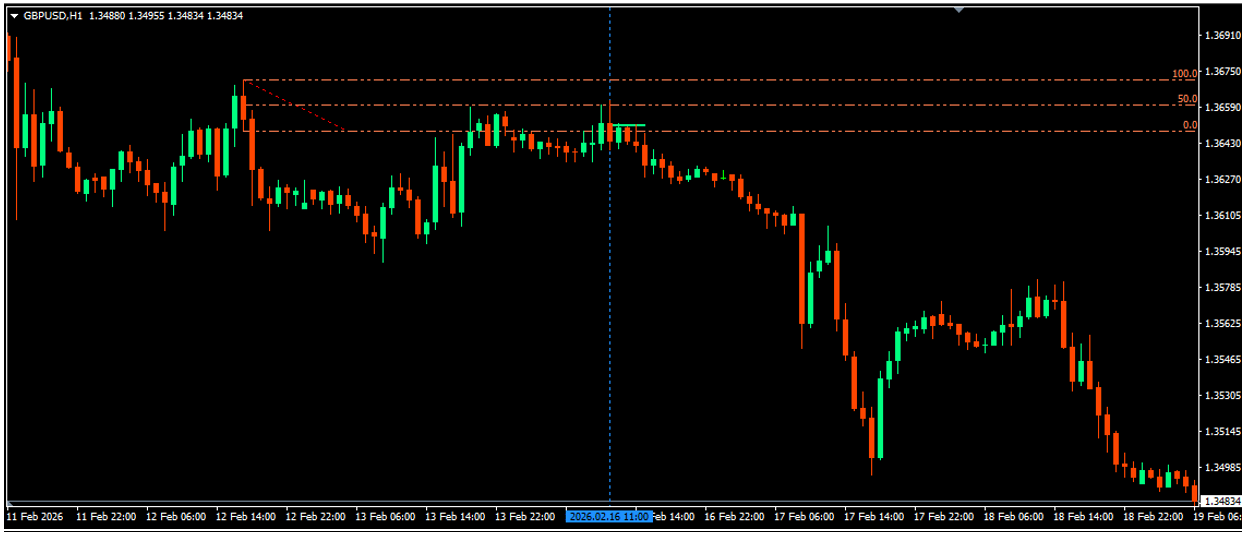
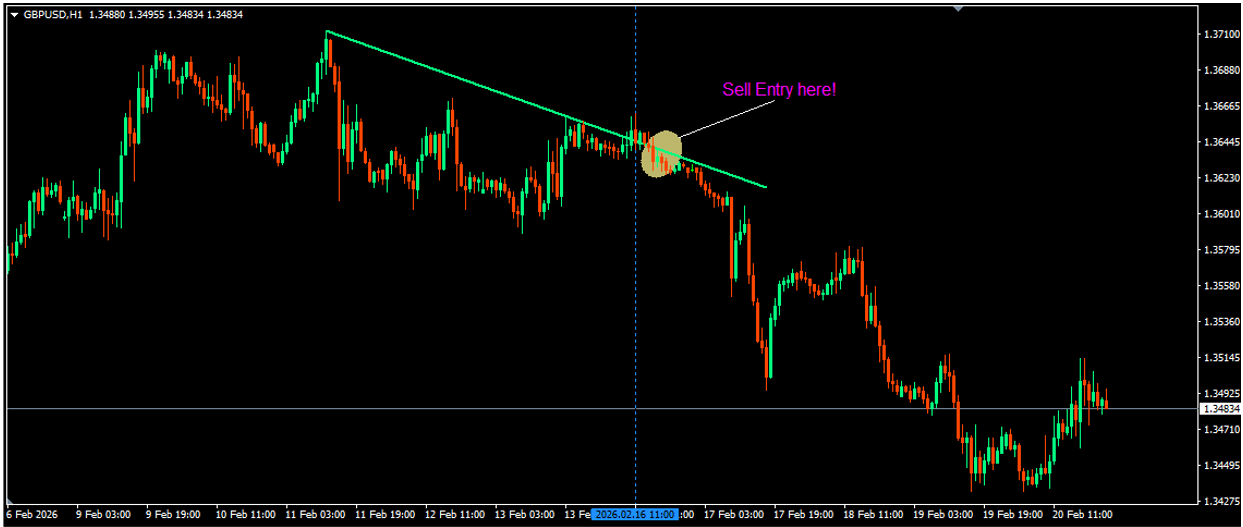
1. GBPUSD Signal date and time (16/02/2026, and Time 9:00am GMT, which falls on 11am on the chart for this broker [GMT+2]; indicated by the vertical blue line.
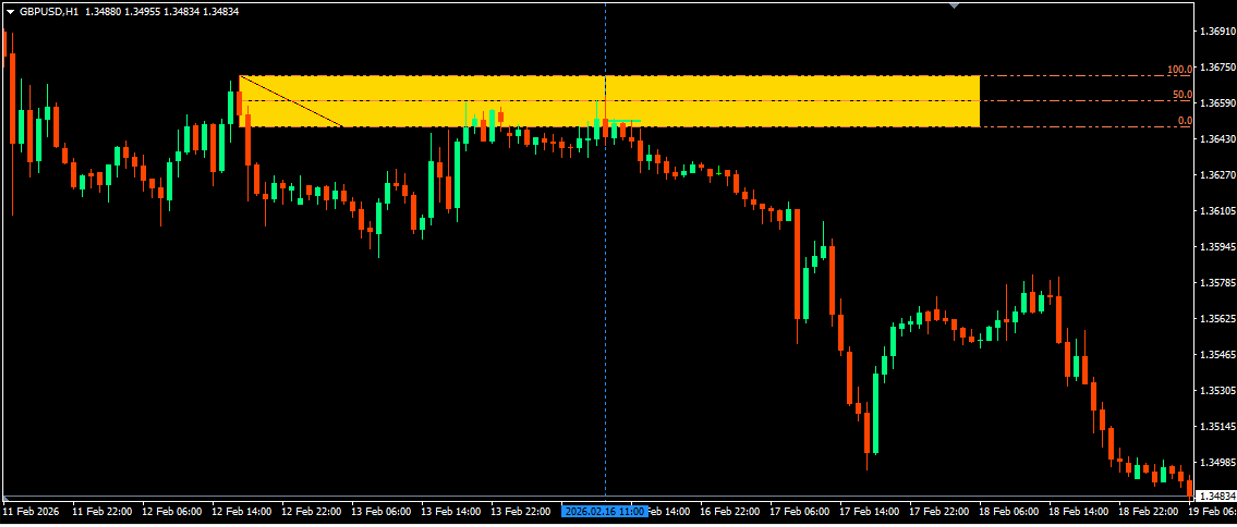
2. Looking to the left, we mark the immediate supply zone before our signal time using the gold rectangle.
3. We wait for a pullback into the supply zone. At the signal time’s closed candle, we could see that we already have “the pullback into the zone”, also both the 10am and the 11am candles (chart time!) have wicked and rejected prices to the upside; price attempted to move to the upside but was forced back by opposite market pressure, which suggests a less buying interest.
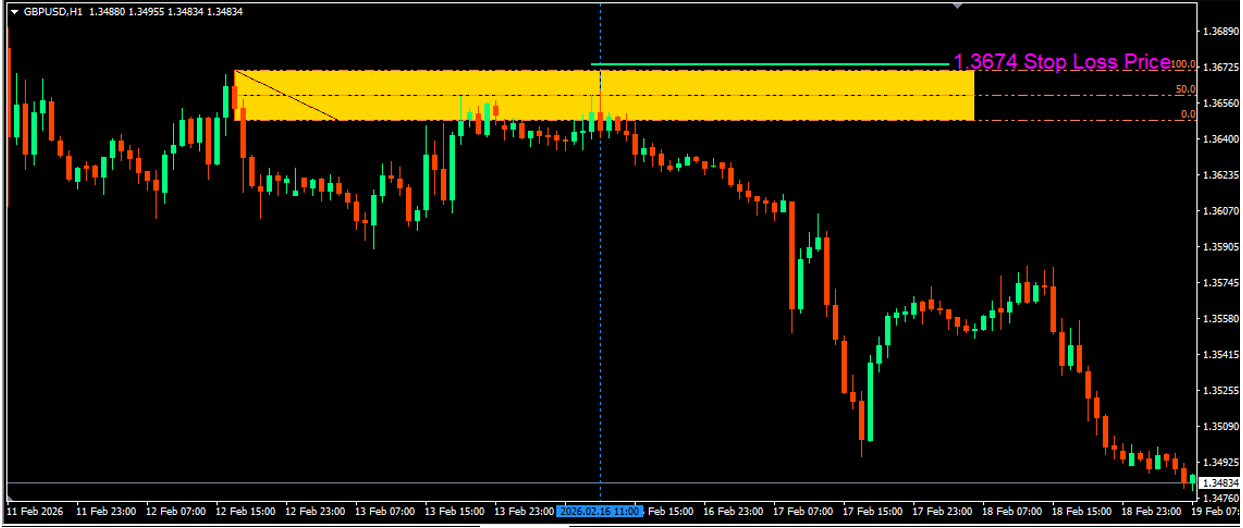
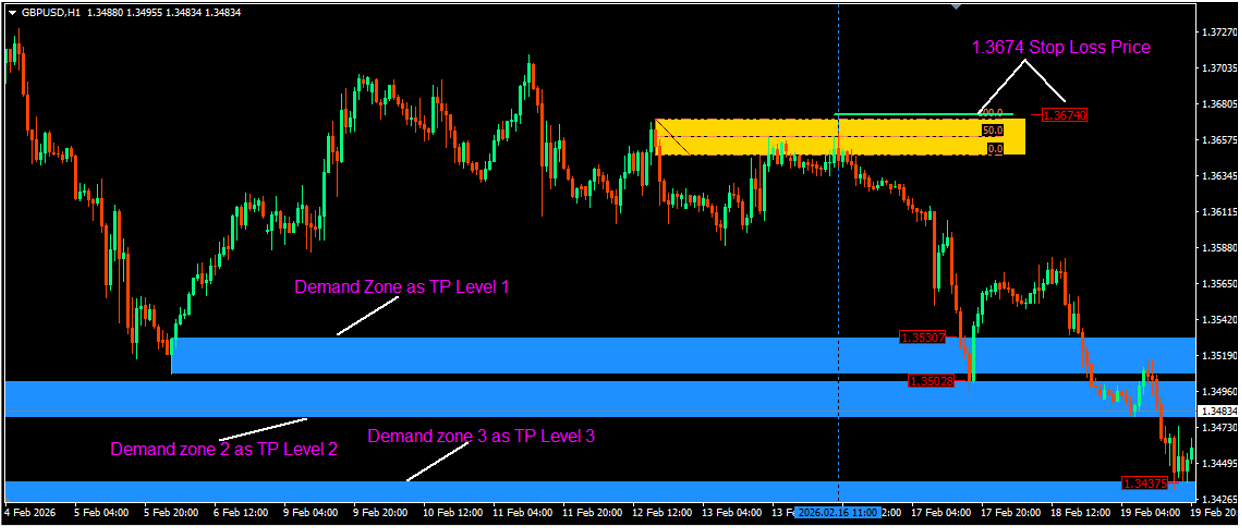
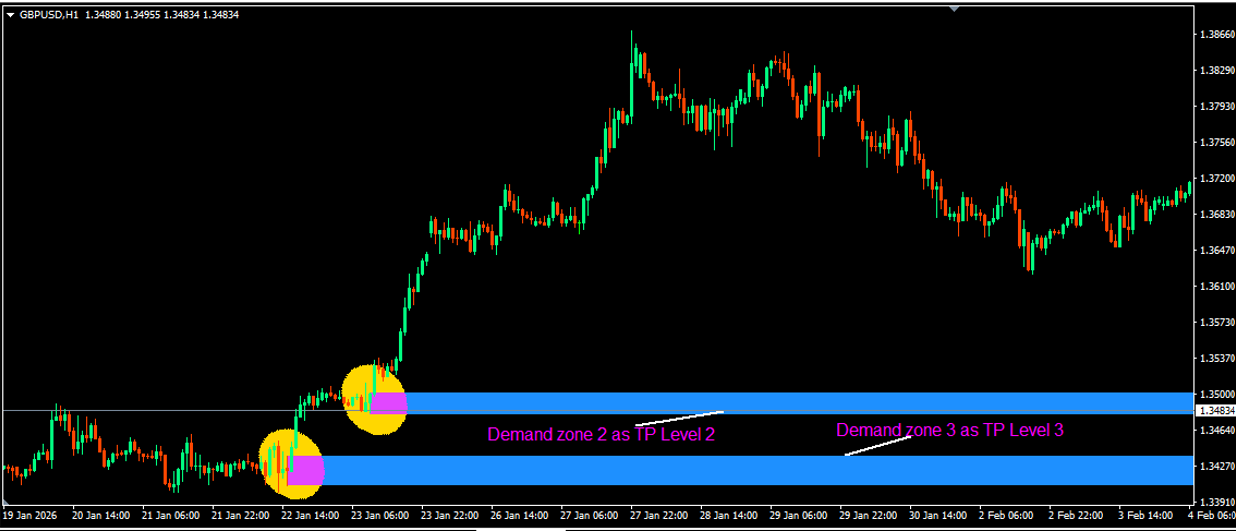
4. We enter a SELL trade here, then place our SL a couple of pips behind the Supply zone. In this case, that was @ 1.3674.
5. We use the Demand zones for our Take Profit (TP) price levels as shown below.
> same steps or process (but the vice versa!) is used to make the BUY entry-timing decisions.
[2] The Sniper Entry Method
This entry method is the most ideal, low risk to high reward ratio, and the most profitable of all, but you may miss some entries. It requires patience!
1. We follow the same steps 1, 2 & 3 as for the Demand/Supply zone entry timing method, but from here…..
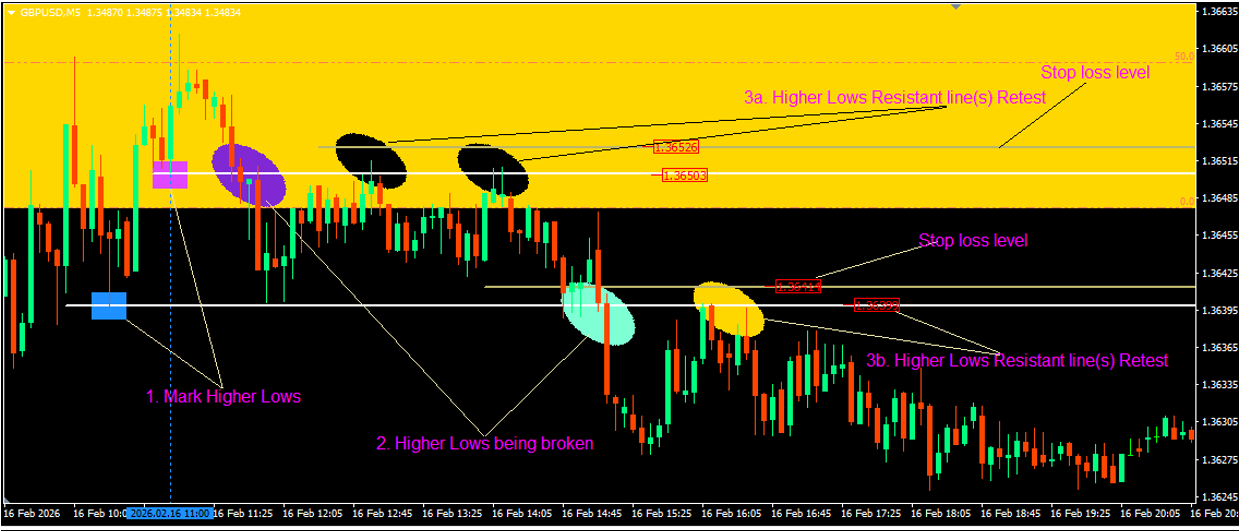
2. We drop the timeframe to the 5-minute timeframe (5m tf!) to time our entry. In this example, we marked the significant Higher Low(s) [on the 5m timeframe] before the signal time and waited for it to be broken. Once broken, the then Support line has now become a Resistant line.
3. We wait for the candle price retest of the Resistant line; at the close of the retesting candle, usually there would be a “wicking” of the retesting candle as an extra indication for the entry. Once these conditions are met we Enter the trade. In this case it was a SELL entry timing.
4. Place the Stop loss a couple of pips behind the retested line, which would usually be about 2pips to max 10pips
5. We use the Demand zones for our Take Profit (TP) price levels as shown for the Demand/Supply zones entry method.
→The same steps or process (but the vice versa!) is used to make the BUY entry-timing decisions.
[3] The Dynamic Trendline Entry Method
1. GBPUSD Signal date and time (16/02/2026, and Time 9:00am GMT, which falls on 11am on the chart for this broker [GMT+2]; indicated by the vertical blue line.
2. We draw a dynamic trendline(s) from before the signal date/time line as shown below.
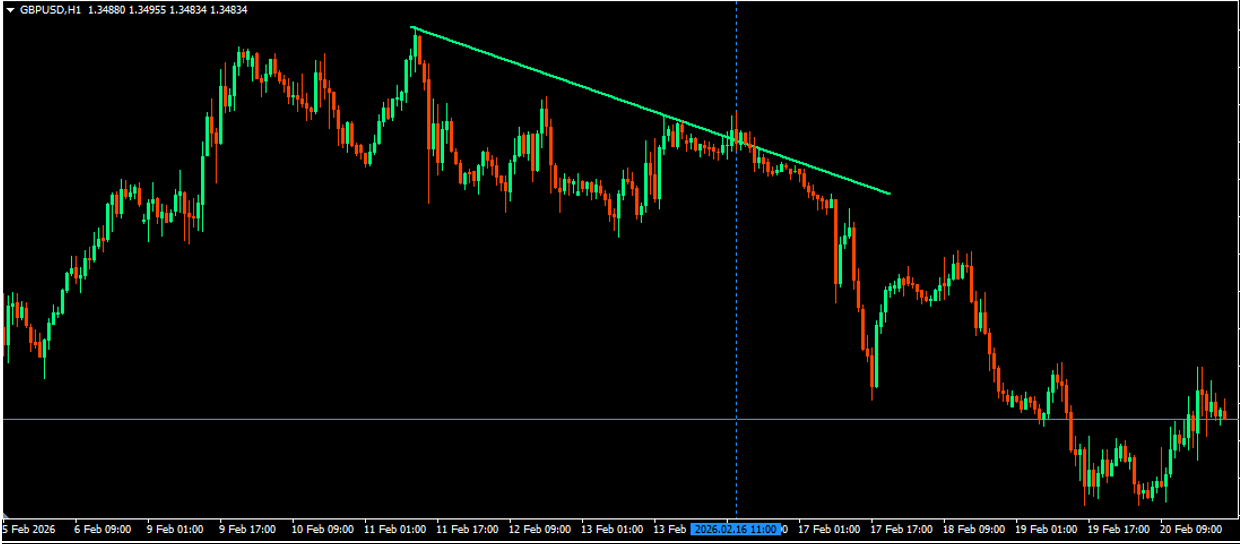
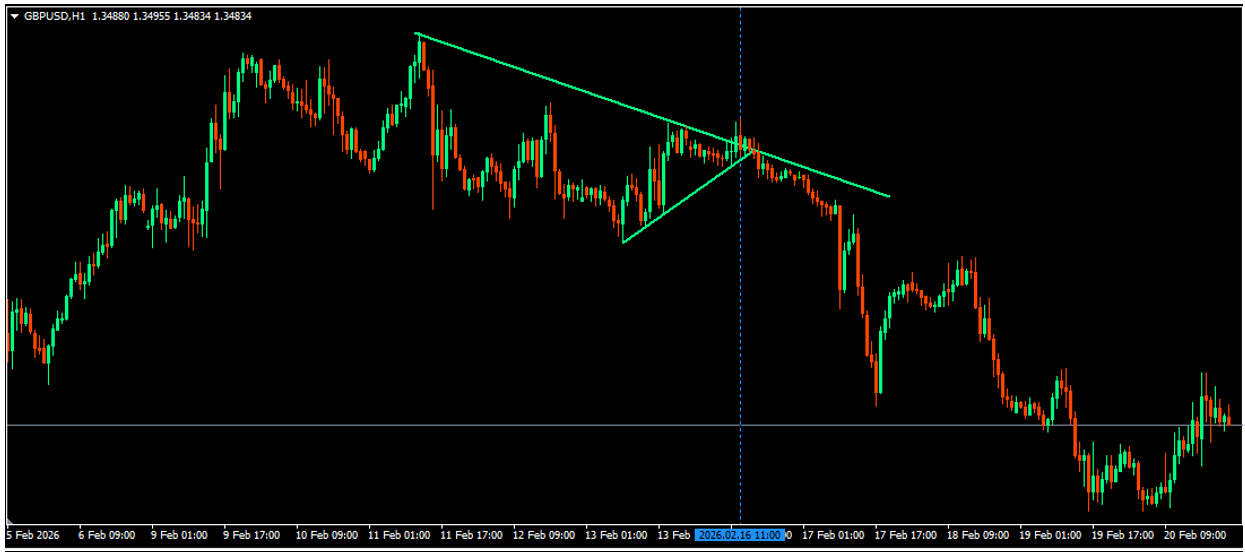
3. We now wait for the dynamic trendline to be broken over, then wait for the market price to drop and close under the trendline to then enter the SELL trade. *In this case, right about the signal time the dynamic trendline was broken over.
4. Place Stop loss few pips behind the candle that closed under the trendline.
5. We use the Demand zones for our Take Profit (TP) price levels as shown for the Demand/Supply zones entry method.
→The same steps or process (but the vice versa!) is used to make the BUY entry-timing decisions.
Recommended foundational studies (a prerequisite to using the HN Market Cycles Signals services):
1. Candle Theory Mastery (Jea FX vids.)
2. Real Supply & Demand Mastery (Jea FX vids. & Pips of Persia)
3. Market Structure Mastery (Jea FX vids. & Pips of Persia)
4. Liquidity Mastery (Liquidity Inducements and Liquidity Sweeps!) (Jea FX vids. & Pips of Persia)
5. Top Down Analysis (Jea FX vids. & Pips of Persia)
6. Institutional Candles (ICs), Insufficiency/Imbalance zones/Fair value Gaps (Jea FX vids. & Pips of Persia)
7. Entry Timing Mastery (Jea FX vids. & Pips of Persia)